Smart Analytics | Blog | Invisible but Important Process: Data Harmonization

March 12, 2020

Invisible but Important Process: Data Harmonization

Here we will talk about data harmonization and standardization. Using a real example we will show how this process can integrate disparate indicators, which will make further operations with data correct and efficient.

What Is Data Harmonization?

Users of analytical and reporting apps often work with the end product without realizing the complexity of the process underlying data dissemination.

At the same time, data harmonization, which in effect is invisible to the user, is one of the crucial stages of the data management process.

Data harmonization allows integrating disparate indicators and joining them in a way that makes them compatible with each other, with data relevant for a limited group of users extracted and set aside (the so-called metadata). The need for data harmonization within any analytical solution is absolutely natural and is dictated by the human striving for arranging information in order and categorizing data for easier access. On the other hand, different systems are supposed to interact with each other using a common language; it is their integration that is reached via the harmonization and standardization processes.

When developing solutions connected with data management systems we often encounter diverse interpretations of indicators. It occurs as a result of the method of calculation, collection, source and structure of the original data.

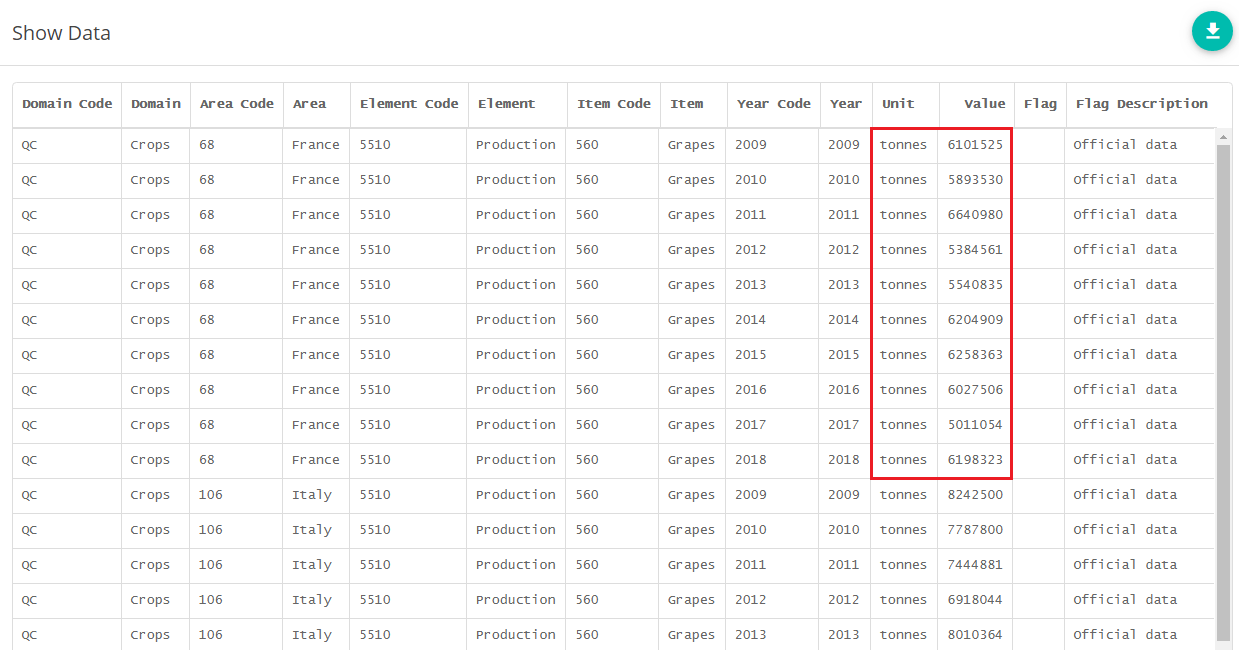
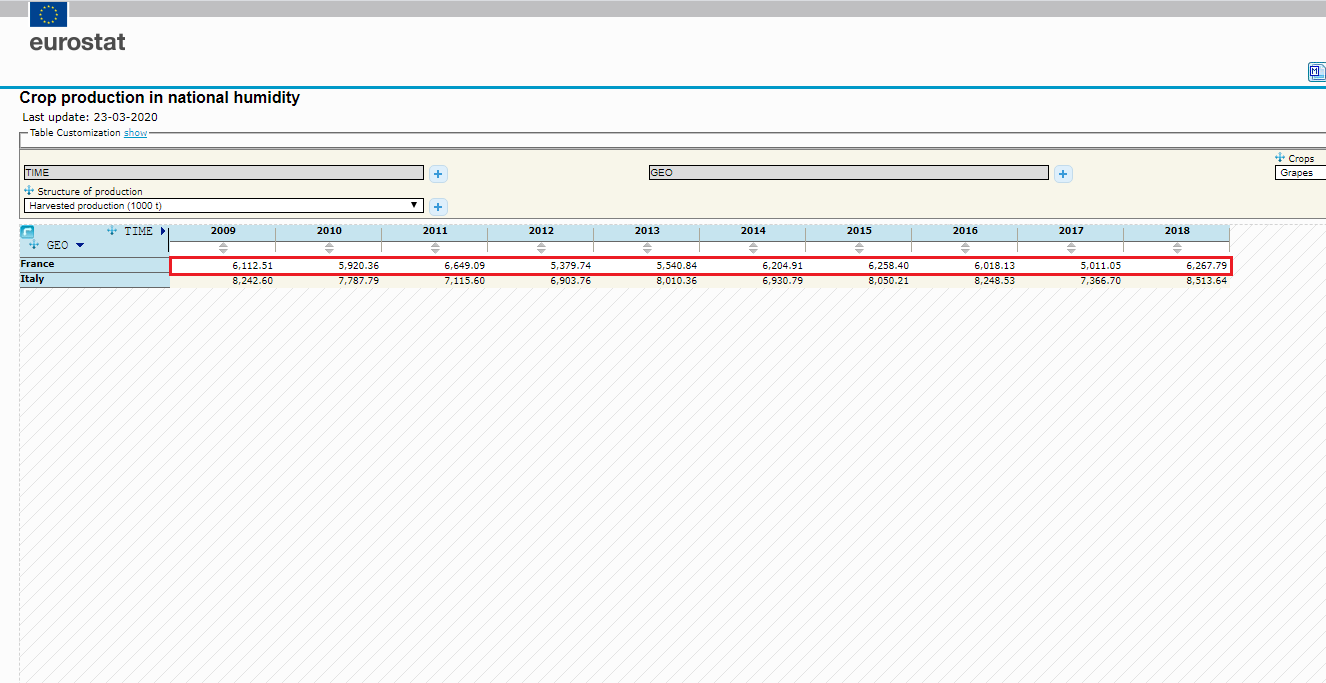
In our example we have two tables taken from popular world statistical data sources on agriculture: Eurostat and FAOStat. Both tables demonstrate data about grapes production in Italy and France in the period from 2009 to 2018. As you can see, the same information is represented differently: FAOStat uses tons for the measure, whereas Eurostat chooses thousands of tons. For further work with the data in the same set, they need to be harmonized.

When Is Data Harmonization Needed?

We will try to explain when data harmonization is needed on a simple example.

Let’s imagine that data source A collects data on different indicators connected with commodity C1 in a number of countries. Since there is only commodity C1 in this source, all the indicators will be classified as follows:

‘Commodity C1 production in tons’, ‘Commodity C1 export, in tons’, ‘Commodity C1 price, $ per ton’, etc.

Source B, in its turn, collects data on the production of all commodities C*. For more convenience it segregates the commodity itself into a separate category: C1 – Production, C2 – Production. At the same time the measures are also given in several categories, but for one country – the USA. They are also given in local measures – pounds, bushels, etc.

If the information from sources A and B needs to be integrated into one dataset, a number of actions are called for to transform the original structure into something different:

  • In source A commodity 1  will be represented separately and will become an independent measure (the same will occur with the measures ‘ton’ and ‘$’), the indicators will transform into ‘Production’, ‘Export’, ‘Price’. Thus we get the following combinations: Country 1 – Commodity 1 – Production – Ton, Country 1 – Commodity 1 – Export – Ton, Country 2 – Commodity 1 – Price - $/Ton, etc.
  • In source B the measure for production with the coefficients of a given value will be converted from bushels into tons. Also a list of the measures is given for reference. Therefore we get the following combinations: USA – Commodity 1 – Production – Ton, USA – Commodity 2 – Production – Ton, etc.

Thus, the data will be integrated into one common set while the information about the source and measures’ transformations can be given in the descriptive metadata.

Data Harmonization in International Organizations

Many international organizations dealing with statistics spend a lot of manpower and financial resources in their attempt to have their data systematized.

One of the better-known examples of such approach is the international statistical data exchange standard SDMX.

But even so, organizations have to handle the first layer of data harmonization themselves.

When developing solutions for data management systems, we often see how indicators are interpreted differently depending on the method of calculation or the collection, source or structure of the original data.

Project Manager

Smart Analytics

It sometimes takes more than a simple procedure of normalizing data. Very often one has to thoroughly study the field, read guidance papers on the data sources, examine a bulk of comments and internal metadata to justify the basis for generalization and ways of standardization. It all is fairly time-consuming and calls for thorough and responsible action.

Specialists in Smart Analytics have enjoyed years of co-operation with organizations which collect, process and analyse statistical data.  Our co-operation yielded a number of successfully implemented solutions, among which Data Management & Data Dissemination stands out, which covers the entire process of working with data, including data normalization and harmonization.

Tags

  • Open Data
  • Statistical Data
  • Data Management
  • Dashboards
  • Economics

Subscribe to the Blog

We will share with you our knowledge and insights. Spam-free, only useful content.