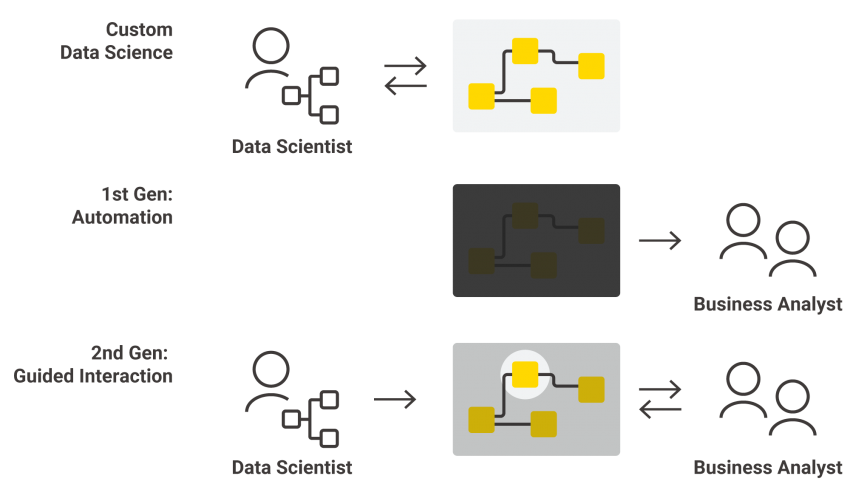
Why guided analytics so useful and convenient?
Guided analytics is usually opposed to self-service analytics. Unlike self-service analytics users, guided analytics users do not need to analyze available data sets, build various reports in search of hidden relationships since all reports and interactive relationships between them are already configured and available to the user. Here and hereinafter, for simplicity, we will not separate the concepts of reports and dashboards, and speaking about reports we will understand by reports any set of visualizers for data, including calculated ones.
Unlike reports developed by the user (self-services), guided analytics’ reports are not customized, they are the same for all users who have access to them. Reports, details within them and possible transitions are configured by developers based on business requirements specific to a particular company in a particular industry. In other words, reports and transitions within and between them are configured specifically for a given problem.
When building interactive reports, it is necessary to predefine indicators and slices to be analyzed when a particular problem is identified.
Thus, it is necessary to predict the behavior of the application user in advance and understand what questions the user will need to answer.
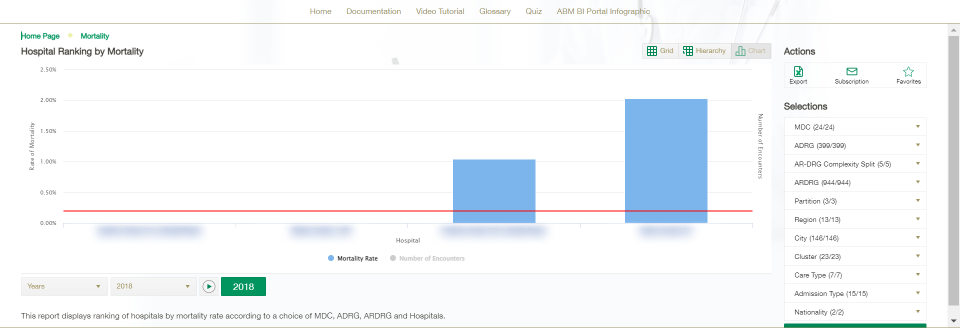
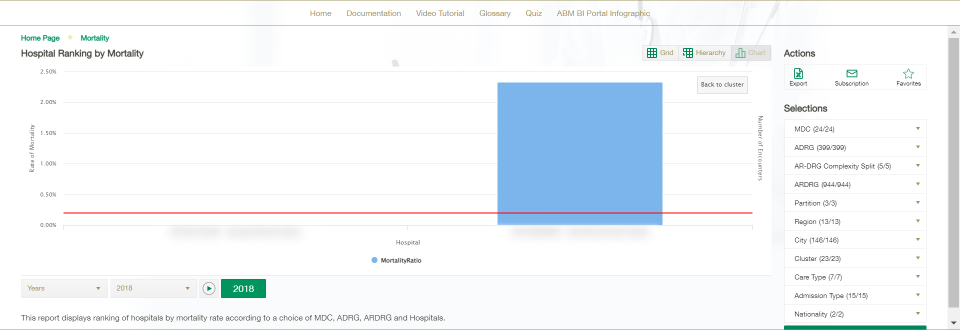
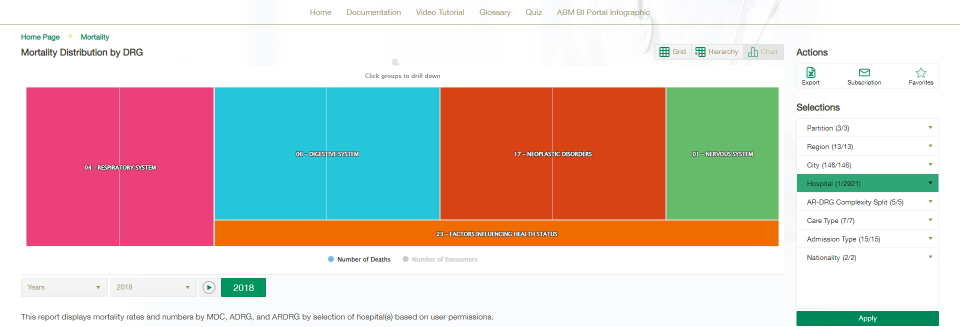
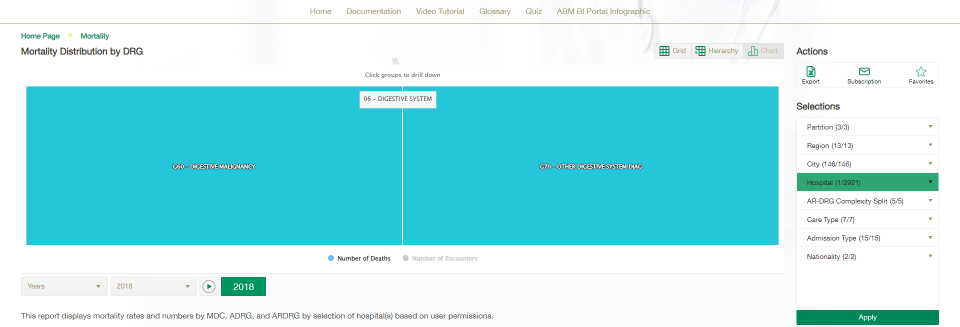
Let's consider a simple case. A company suffers a drop in sales revenue in a given month. What questions might need to be answered? For example, is such a decline due to a drop in revenue at a particular outlet? Or is it due to a decrease in sales of a certain type of product? When there was a decrease in sales of any product at a particular outlet, on what day of the week or on what date did the decrease occur? What was the working hours at the point at that day? Who worked at this outlet? And so on….
Users do not need to have any specific skills, they are not required to hypothesize relationships between data or spend time analyzing available indicators and choosing appropriate visualizers. Linked reports enable the user to move from the general to the specific, to find the "roots" of the problem, and to define subjects whose behavior need to be adjusted to solve the problem. The sequence of analysis steps and the list of questions that need to be answered should be determined at the stage preceding the development stage by experts who are specialized in the particular field. As a result, guided analytics should help in identifying insights in the data and in making the right management decisions.
Of course, the guided analytics has its own limits. For example, users can not change visualizer, add one more or several computable metrics, or download data for additional indicators. Also, it takes a lot of upfront work to build really valuable reports. To develop interactive reports that bring business value, a deep study of the available data should be made at the analytics stage.
Our company develops analytical systems that provide both individual reports and interconnected interactive reports, allowing users to drill down to the required elements, and switch to related reports that characterize the desired issue in more detail. To develop such systems, we conduct interviews with key experts of customers, we determine the customer’s challenges and concerns; if there are existing solutions that no longer satisfy users, we clarify claims to existing solutions and requirements for new/improved solutions. We find out what tasks the developed application should solve, study the available data from internal and external sources, assess the available data slices and, together with the customer, determine “how we will lead the user” through reports. Such a detailed examination of the customer's business processes at the analytics stage allows to free users from the need to conduct such analysis in the future.
If you have any further questions email us or leave your contact information here.