Smart Analytics | Blog | What is Predictive Analytics?

March 4, 2022

What is Predictive Analytics?

Today, there is hardly a company that is not familiar with the concept of data-driven approach. In a highly competitive environment, it is difficult to make the right managerial decision based only on your intuition, guesswork and own opinion. This is where data analytics comes in.

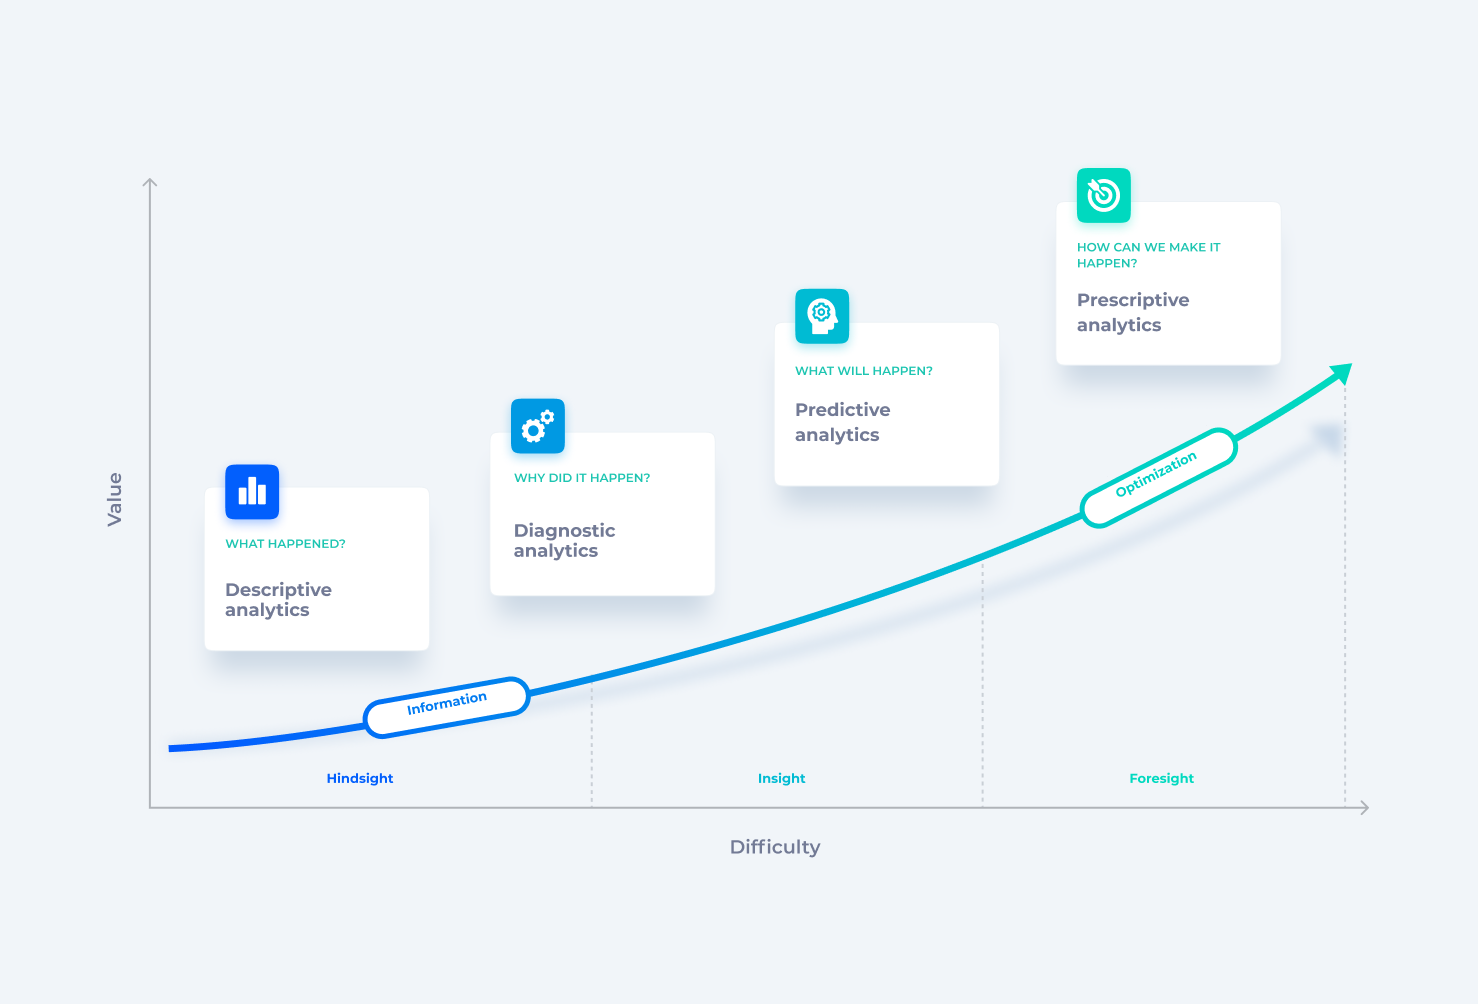
Below is an overview of types of data analytics and their benefits. As a rule, there are 4 types of data analytics.

  • Descriptive analytics answers the question “What happened?” at a particular point in time or over a period. Analytics of this kind can be powered by various visualizers. For example, to identify the problem of falling profits of a company, it will be enough to view a table with data in dynamics or a line chart.
  • Diagnostic analytics answers the question “Why did it happened?” For example, why the company costs increased? Diagnostic analytics is designed to explain the causes of events; to identify the main factors that influenced the analyzed event, statistical methods of data analysis are used.
  • Predictive analytics is designed to predict unknown events in the future, thereby answering the question "What will happen?". For example, how will sales change by the end of the current year? Predictive analytics is a set of data analysis methods with their further interpretation, which enables you, based on the accumulated information, to determine trends in the analyzed indicators and predict future events.
  • Prescriptive analytics answers the question "What should be done to achieve the desired result?". For example, what activities will be required to achieve the desired production volume? Prescriptive analytics applies various methods of artificial intelligence using the entire array of accumulated data.

In this article, we would like to dwell on predictive analytics in more detail and consider the reasons why it is in demand and is so popular today, and share an example from our practice.

About Predictive Analytics

So, why is predictive analytics so popular? Let's analyze the simplest cases. A company produced perishable products, but could not sell them due to reduced demand. Or, on the contrary, the demand for services on a weekend was high, but the number of available specialists was not enough to fully satisfy it. These problems could be avoided if there were predictive estimates of demand for products.

Predictive analytics can be used in completely different fields: in healthcare to predict diseases and complications in patients; in industry for predicting equipment breakdowns, planning equipment maintenance and optimizing its operating parameters; in marketing for customized offers to clients, optimization of marketing channels and for predicting the behavior of the target audience; in insurance sector to determine the size of the insurance premium, taking into account the expected losses. This list could be unlimited...

Thus, there is no doubt that predictive analytics gives the company an advantage over competitors that have not implemented it, since the company's managers and employees know what to expect tomorrow and in the more distant future, and, as a result, they understand what solution will be optimal for a given situation. Companies use predictive analytics to find patterns in data in order to identify potential risks and threats for their activities and discover new opportunities. In other words, data can optimize operations and contribute to the growth of the company's profits.

Implementation of Predictive Analytics

So what is needed to implement predictive data analysis? The predictive analysis process can be described as a multi-step process in which raw data are verified and processed to generate predictions based on a mathematical model.

The first step is the task statement. Before creating a predictive model, we should decide what output indicators we want to get, for what period, in what dynamics and by what categories. Moreover, for subsequent data collection, we need to formulate hypotheses about the expected influence of certain factors on the analyzed indicators.

After the task is set and the hypothesis is formulated, we can proceed to collect historical (retrospective) data both for the analyzed indicators and predictors (factors). The computing power of companies has been growing in recent years, they collect data on their internal indicators and processes, and on external factors, therefore, it is important to determine the required data sources among the available corporate ones and, if necessary, supplement them with external ones when collecting data.

When collecting data, we should take into account their volume (depth of retrospective) and quality. Efficient analysis and objective conclusions are possible subject to a large amount of relevant data. As for the data quality, the data must be accurate and error-free, that is, such that they can be relied on and correctly interpreted. The collected data are verified and “cleaned” from errors, such as duplicates, outliers, adjusting incorrect formats, and so on. 

Once all the data are collected, we can start handling them. It is the research (exploratory) data analysis. On this stage, we identify patterns and hidden relationships in data, the so-called "insights", and build a predictive model is built. When building a model, it is important to identify predicting factors that affect predicted indicators / phenomena. For example, to build forecasts of demand for products, we can consider such predictors as weather conditions, seasonal sales, days of the week and holidays, seasons and time of day, as well as the price level, monetary incomes of the population, etc.

It should be noted that for models containing socio-economic indicators (variable parameters of the external environment) among predictors, it is advisable to build scenario forecasts (depending on alternative scenarios of situation). Scenario forecasting allows you to use several options for the most likely scenarios (including baseline, pessimistic and optimistic), that will enable a company to quickly refocus in the future in changing conditions. By way of example, our company has developed a predictive model designed to predict regional labor force balances and unemployment rates by industry.

We determined the scenario and control parameters, developed the analysis scenarios and built a forecasting model based on the methods of correlation and regression analysis. Among the scenario parameters, we used such indicators as changes in the population size by age groups, the index of physical volume of production by industry, investment, and the index of real disposable money income.

At this stage, statistical methods and data mining methods are applied. The current trend is the use of machine learning. Regardless of the method used, an important step in building a predictive model is its testing for assessing the accuracy of its outcomes, and correcting the model, in necessary, and further re-testing it.

Based on our experience, we would recommend developing predictive models within a single analytical system, namely, together with design of a single data warehouse, and, if necessary, setting up automatic data download from the websites of statistical agencies, introducing tools for initial data validation, developing input forms for scenario parameters and reporting forms/dashboards to display the values of forecast indicators.


Our company will be happy to help you to develop such systems.

Subscribe to the Blog

We will share with you our knowledge and insights. Spam-free, only useful content.