Smart Analytics | Blog | How we implement Qlik Sense so that the solution quickly pays off and generates extra profit

November 29, 2021

How we implement Qlik Sense so that the solution quickly pays off and generates extra profit

This article is about the benefits of solutions powered by Qlik Sense, the implementation stages and the business tasks that can be solved with their capabilities.

Business intelligence is more than timely and complete reports, great-looking dashboards, and the single version of the truth. Organizations use data analysis, modeling and forecasting systems (in particular, solutions powered by Qlik Sense platform) to improve management efficiency and take advantage of innovative technologies in a rapidly changing world. According to international research agencies, most companies around the world steadily consider BI as one of the top priorities in their IT strategy.

In May 2021, Gartner analysts reported that the BI market grew 4.4% in 2020 to reach $ 25.5 billion. Non-relational DBMS, analytics and business intelligence platforms were the fastest growing segments, primarily due to the need for information that can be relied on in making decisions in the period of global changes caused by COVID-19.

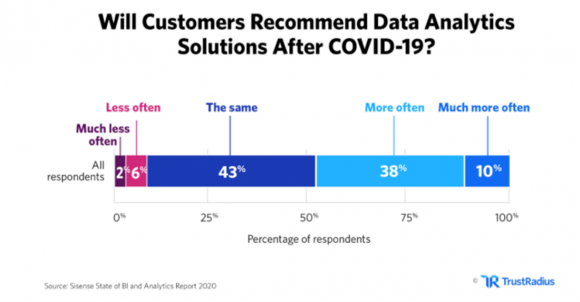
A study carried out by Sisense in 2020 showed that 50% of companies are more likely to use Business Intelligence tools more actively after the pandemic. 55% of businesses will maintain their level of BI expenses after the pandemic, and 10% of businesses plan to increase their BI budget.

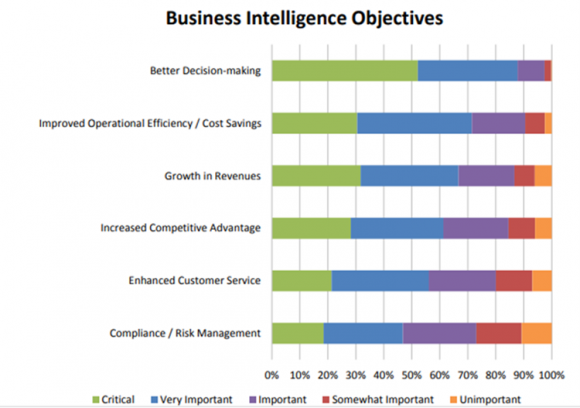
Among the key advantages of any advanced business intelligence system, customers appreciate the following:

  • Efficient data-driven decision-making
  • Increased efficiency at reduced cost
  • Increase in revenue
  • Improved competitive advantages
  • Enhanced customer service
  • Better compliance / risk management

Five key benefits of BI solutions were identified by the vast majority of respondents as “critical” or at least “very important” to their business.

Moreover, other important benefits of using BI tools are:

  • Timely response to external and internal challenges
  • Creation of a common corporate culture of data handling
  • Streamlined collection, processing and analysis of heterogeneous management data
  • Elimination of the human factor from routine data operations

Qlik Sense benefits

In case of Qlik Sense, for which the number of corporate users has already exceeded 50,000 companies around the world, implementation costs quickly pay off due to the following advantages:

For companies:

  • Customer receives a business analysis system based on world best practices and industry specifics
  • Implementation and customization of the solution takes only a few days (against weeks and even months when developing a "tailored" solution) and in most cases do not need suspending business processes and interrupting users from work
  • Resources allocated for data preparation and analysis are freed for other purposes
  • Accelerated reporting based on data stored in different systems
  • Reducing the time of putting final data products in operation by company employees
  • Improved performance of end-users, analysts and data engineers
  • Self-service BI solution reduces the load on corporate IT services since all data analysis operations can be performed without involving technical specialists

For users:

  • Users get a powerful and easy-to-use solution that quickly processes large amounts of data
  • Business users can select any method of in-depth data analysis and visualization of its results, and can access online data through a convenient and flexible interface on a PC, tablet or mobile devices
  • Users can independently configure the system: create new types of objects, links between them and attributes without the need to contact IT specialists and upgrade the solution

Implementation stages for solution powered by Qlik Sense

To quickly get a financial benefit from implementation, we recommend you first to select the departments that have the maximum impact on company’s profitability (most often these are sales and marketing department, and administration), use standard solutions and best practices that have proven efficiency for similar organizations. The approach to implementing Qlik Sense can differ depending on the industry, company size, budget, and many other factors that must be taken into account. However, although each company is unique, specialists accumulate experience over the years, which accelerates the solution implementation and generation of profit. We have identified the most well-trodden path enabling us to solve the task, which helps all our customers to achieve excellent results.

Standard scheme of Qlik Sense implementation

Here's a tried out scheme that help us quickly deploy Qlik Sense and enable our customers to use it to cut costs, increase revenue, and find new growth points for their organization.

Overall solution architecture

At the very beginning of any project, we build a team, define goals and objective together with the customer, clarify customer’s requirements, design a solution, shake hands and cut the ribbon at the opening of Qlik Sense Enterprise server.

Next comes the stage of technical implementation.

Common solution layout looks as follows.

Data Layer: data sources and source data

If we are not talking about large integration tasks, then we usually have:

  • 2-3 small data sources. As usual, they include 1 or 2 data warehouses based on the most popular DBMS, and a domestic/foreign ERP system
  • Mapping rules, since the same business entity in the above systems can have a different key/code/identifier
  • Formulas for calculating indicators

QVD Layer: middle layer of QVD files

In a real project, we usually retrieve data from a database or any other data source and save it to QVD files using Qlik Sense tools. One QVD file contains data from one spreadsheet. These files can not only be created but also read using Qlik Sense. What is special about these files? You can load them to Qlik Sense on-the-fly. Subject to the correct optimization, downloads are 10 to 100 times faster than from any other source. QVD files are the core of any Qlik-based solution. A rare project is implemented without them. There can be several QVD layers, depending of calculation complexity. For example, the first layer presents raw data, the second – processed data, the third – aggregated data, and so on.

Business User Layer: Dashboards

Our specialists create a set of standard dashboards to enable the customer solving routine business tasks. Thus, if the customer faces similar business tasks in the future, he can deal with them by replicating and easily enhancing the existing dashboards.

User training on Self-Service capabilities of Qlik Sense

Users gain insight into all the advantages of Qlik Sense when we demonstrate its self-service capabilities. With these capabilities, you can download, enrich and simulate data, select desirable views, and publish the analysis result to the public domain, all of that without contacting an IT service.

Smart Analytics case studies

Smart Analytics is an authorized Qlik partner. We have more than 5 years of experience in implementing BI systems (and our key staff is experienced in BI market for over 15 years). Here are some examples of the benefits offered by our BI systems to customers from the oil and gas industry, retail, banking, telecommunications, and logistics sectors:

  • Achieved target economic indicators due to improved performance of the production equipment ensured by a comprehensive analysis of actual and forecast performance indicators of oil and gas equipment received from various corporate sources
  • Increased profit by leveraging customer base and efficient use of customer knowledge. To do so, we implemented the advanced tools for customer data analysis and ensured the development of necessary competences for using available information that allow generating customer-tailored offers
  • Optimized staff number by eliminating the need for creating hundreds of reporting forms in Excel. Instead of them we developed a couple of analytical dashboards
  • Search for new ways of developing business and improving its profitability due to the automated reporting, which replaced dozens of regular reports. Analysts were enabled to save about 35% of their time, which they could spend on testing hypotheses, rather than preparing regular reports
  • Reduced hardware costs: using Qlik Sense as a data warehouse without the need to invest in a separate DWH

Order a system demo, contact us by email, or place a request on our website, and we will contact you soon!

Subscribe to the Blog

We will share with you our knowledge and insights. Spam-free, only useful content.